Fair Share in Banking at a Glance:
Understanding “fair share” gives financial institutions a data-backed lens for evaluating market opportunity. By benchmarking deposit share against local population and competitors, banks and credit unions can pinpoint underperforming areas and untapped growth potential. Below are some bank brand optimization strategies that shouldn’t be overlooked:
- Quantify opportunity: Use fair share analysis to reveal gaps between market size and brand performance
- Set realistic goals: Base growth targets on objective market benchmarks and data, not assumptions
- Strategize by segment: Tailor outreach and branch investments where share potential is highest
- Track and adjust: Continuously monitor performance to capture incremental market gains and identify gaps
Why Fair-Share Matters for Growth
The concept of fair share – the proportion of business a bank could reasonably expect within a market – is one of the linchpins in defining market opportunity. The fair share model helps banks determine the scale and scope of investment within their local markets. With this measure in place, banks can begin to grasp how their branches rank in terms of opportunity and prioritize and categorize tiers of transformation based on these burgeoning prospects.
Stable vs. Turnover Households (Fair-Share Model)
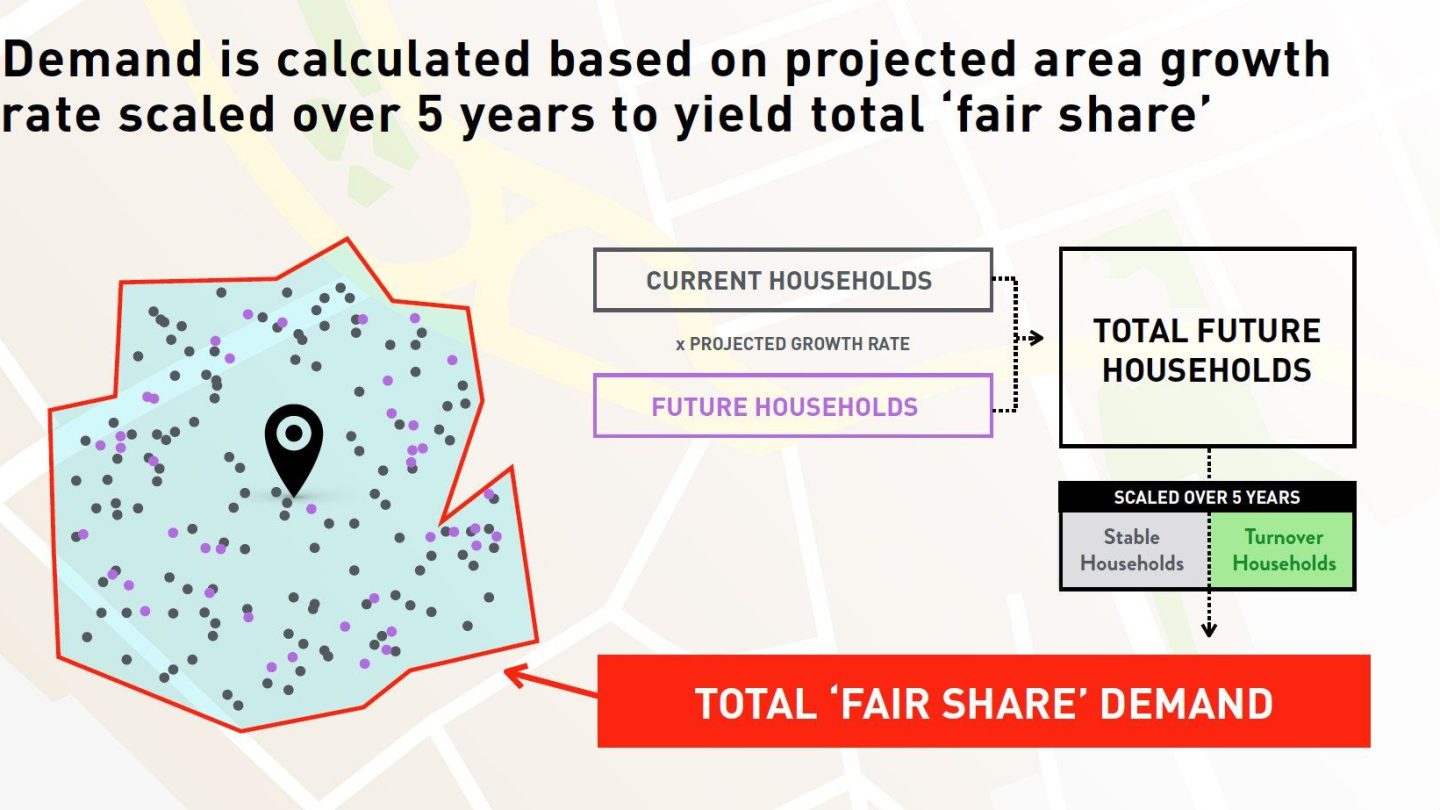
The fair share calculation takes into consideration current and future households and the projected growth rate to determine the number of total future households within a market. Scaled over the next five years, the total future households are then divided into stable and turnover households to paint a full picture of the total demand and opportunity available within a market. In this calculation, stable households include those whose members are satisfied with their banks, and turnover households include people moving into the market, along with customers who are ripe for departing their current financial institutions.
Calculating the Fair-Share Gap
The next step in assessing their potential is calculating how bank branches are performing in relation to their market opportunity. This measure is known as the fair share gap. In this analysis, each location is examined to determine which branch is ranking at fair share, exceeding fair share, or trailing fair share and specifically by what measure. In short, banks are looking at which branches are taking full advantage of their market potential and which ones are leaving money on the table. These fair share gap analysis metrics are gathered to calculate an aggregate opportunity across the branch network. This cumulative total is for consumer and business banking alike, including all deposit and loan activity.
Ranking Branches A–D by Opportunity
After analyzing the fair share gap, a branch’s performance can then be ranked based on market opportunity, ultimately funneling all of the market analysis information into a top-to-bottom classification. This branch ranking is a function of the overall market opportunity and the gap to achieve that opportunity. Lines of demarcation between levels will vary by institution, but will generally be categorized from A to D. A-level branches are underperforming in high opportunity markets; B-level branches are performing adequately in markets with moderate potential; C-level branches are operating in markets with little potential; and D-level branches are in the position to be consolidated due to redundancy.
These branch-level ratings help to inform the implementation tiers in branch optimization and transformation initiatives, namely Refresh, Transition, Transform, and Closure. These performance and market insights factor into decisions being made about what tier and type of renovation each branch is a candidate for and what percentage of investment each bank is capable of making. It’s important to note that these A-D branch rankings alone do not dictate which branches to close, but simply provide the diagnostic tools to help guide these judgments. Some banks may want to keep certain branches open but for other, less performance-based reasons like legacy or perceived presence in a particular market.
Refresh: Quick Cosmetic Upgrades
At the Refresh tier, exterior and interior upgrades include more surface-level changes like finishes, environmental graphics, and digital signage. These branches only need cosmetic upgrades to bring them up-to-date and require a lower financial investment to do so.
Transition: Operational Shifts
At the Transition tier, operational and visual changes require moderate financial outlays to adopt the universal banker model, branch automation technology, enhanced drive-up options, and staff training.
Transform: Full Reimagining
The Transform tier requires the highest level of investment as it reimagines how the branch operates. Large-scale branch transformation includes repurposing store space, de-tethering staff, integrated delivery, flexible space plans, and a platform for all lines-of-business.
Closure: Strategic Consolidation
The Closure tier represents the most decisive action in bank branch optimization, as it strategically reduces physical footprints while redirecting resources to high-performing locations. This consolidation approach involves carefully evaluating underperforming branches for closure or merger opportunities, ensuring customer relationships and market presence are preserved through enhanced digital channels and strengthened neighboring locations.
To learn more about optimizing your bank or credit union branch network, get in touch with the brand-to-branch experts at Adrenaline.
Adrenaline is an end-to-end brand experience company serving the financial industry. We move brands and businesses ahead by delivering on every aspect of their experience across digital and physical channels, from strategy through implementation. Our multi-disciplinary team works with leadership to advise on purpose, position, culture, and retail growth strategies. We create brands people love and engage audiences from employees to customers with story-led design and insights-driven marketing; and we design and build transformative brand experiences across branch networks, leading the construction and implementation of physical spaces that drive business advantage and make the brand experience real.